Skip to content

Product Engineering Case Study

wemovin

A real estate search platform designed to connect location intelligence, large-scale property data, map-driven discovery, and user/listing workflows into one scalable web application.

My role

Founding Frontend Engineer & Technical Lead

I helped shape the first web phase from architecture to implementation: location API integration, map/listing synchronization, address-based routing, typed property data, reusable UI systems, and performance-aware frontend decisions.

Next.jsTypeScriptTailwind CSSGoogle Maps APIPlaces AutocompleteSEOTestingScalable Architecture
WeMovin interactive map search interface
Image description

The image shows the WeMovin map-based property search interface. The screen is divided into two main areas: a large interactive map on the left and a grid of property listing cards on the right. The map is centered around Corpus Christi, Texas, and contains multiple price markers such as $118.5K, $229.9K, $459.9K, $319.9K, and $445K. One map marker is selected and opens a preview card with a property photo, address, and price. A search input appears near the top of the map. On the right side, property cards show home photos, sale status labels, addresses, prices, bedroom and bathroom counts, square footage, agent information, and save icons. The interface demonstrates how map markers and listing cards work together in a real estate search experience.

Context, Role & Constraints

Phase 1 web release for a search-first real estate product.

WeMovin was planned as a phased real estate platform built around address search, map-based discovery, property exploration, and future owner-facing workflows. The first release focused on proving the core web experience: search, explore, open a property page, and move toward a listing or contact action.

Organic search was treated as a core acquisition channel from the beginning. In a competitive real estate market, the frontend needed to support readable property URLs, SEO-friendly pages, strong performance, and a structure that could scale as more listings and data providers were added.

I joined at the foundational stage as Founding Frontend Engineer & Technical Lead, helping shape the technical direction before the main build was locked in.

My ownership

Web MVP

Product vision translated into frontend architecture.

Technical direction

Defined the stack, routing approach, map/search strategy, and scalable frontend structure.

Product translation

Turned founder vision into practical flows, reusable components, and achievable engineering milestones.

Search & map system

Led the Google Places, address routing, map viewport, markers, and listing-card interaction model.

Frontend foundation

Structured the web app around typed data, reusable UI, service boundaries, and future product growth.

Technical Decision Log

Trade-offs shaped the stack, not technology preference.

Before the main build, the product direction was informed by patterns from established real estate platforms such as Zillow and Realtor: map-first discovery, listing-card layouts, property detail structures, and SEO-driven routing expectations.

The technical direction was shaped by trade-offs: speed versus flexibility, SEO versus client-only simplicity, managed deployment versus infrastructure control, and mature location APIs versus request-cost management.

Decision framework

Foundational phase

Architecture decisions were evaluated against product needs and technical constraints.

Frontend foundation

Next.js App RouterTypeScriptTailwind CSS

Compared against

Client-only SPAheavier UI component librariescustom CSS architecture

Why this direction

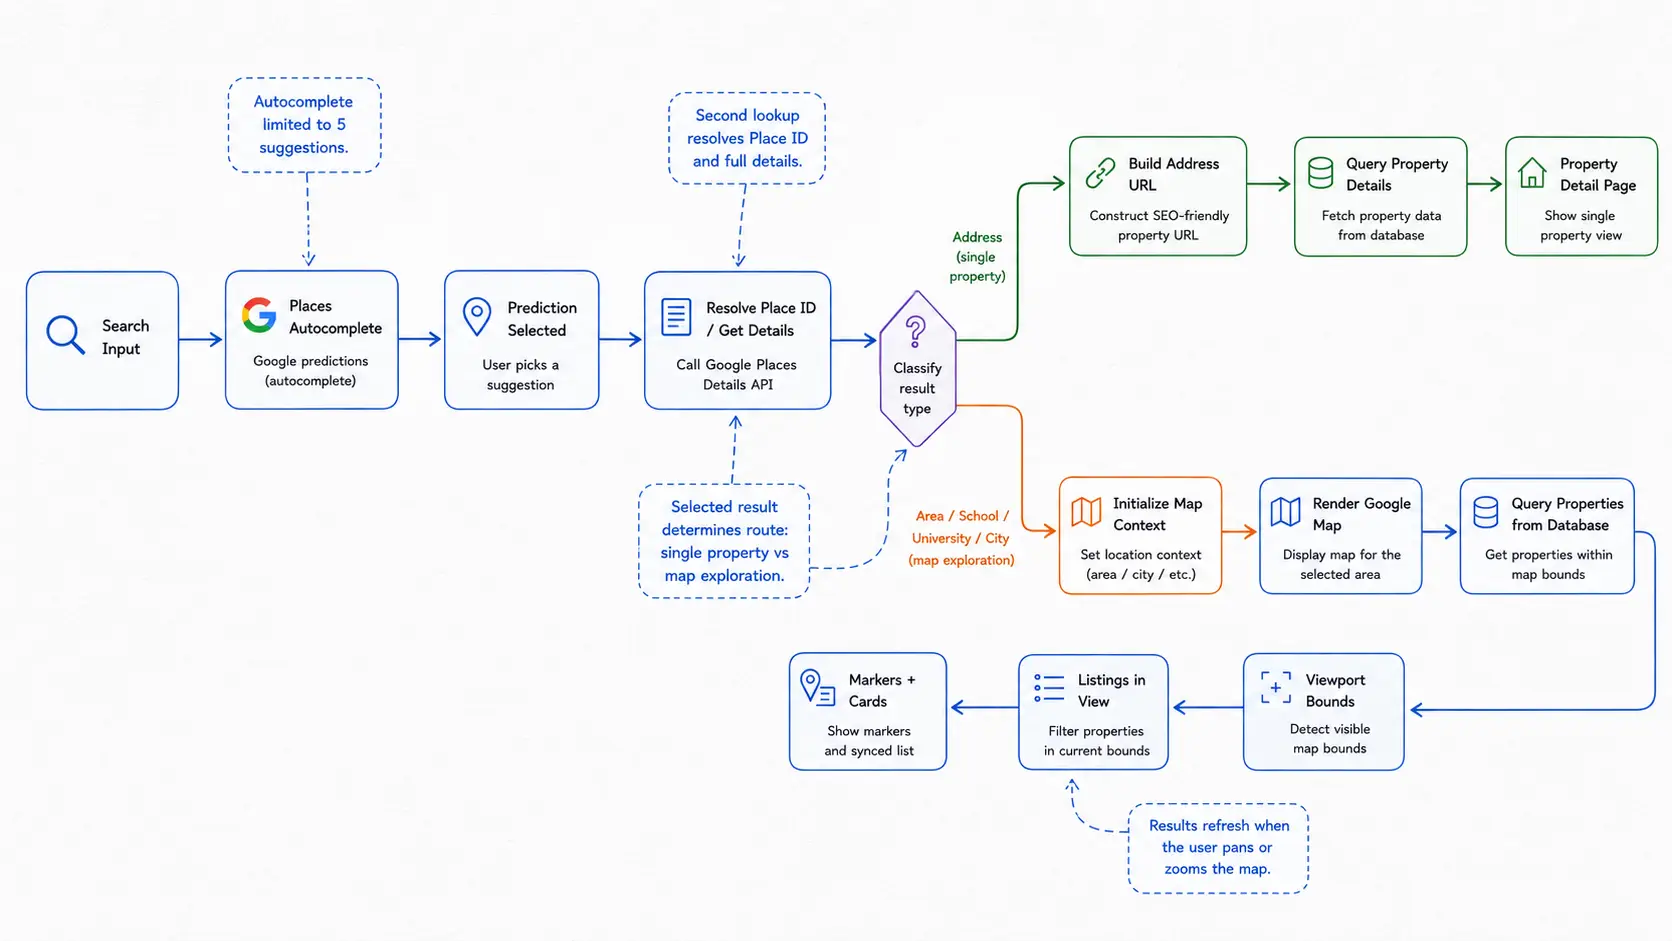
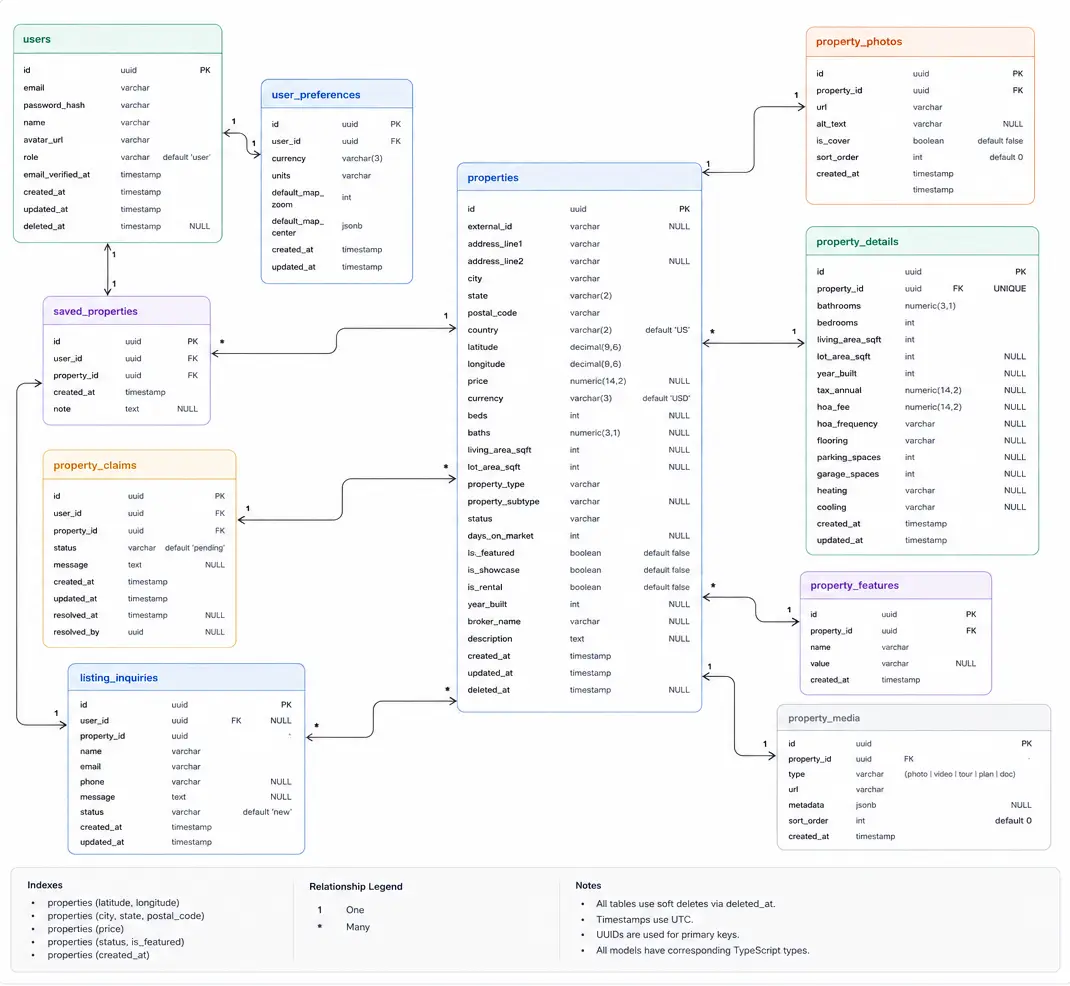
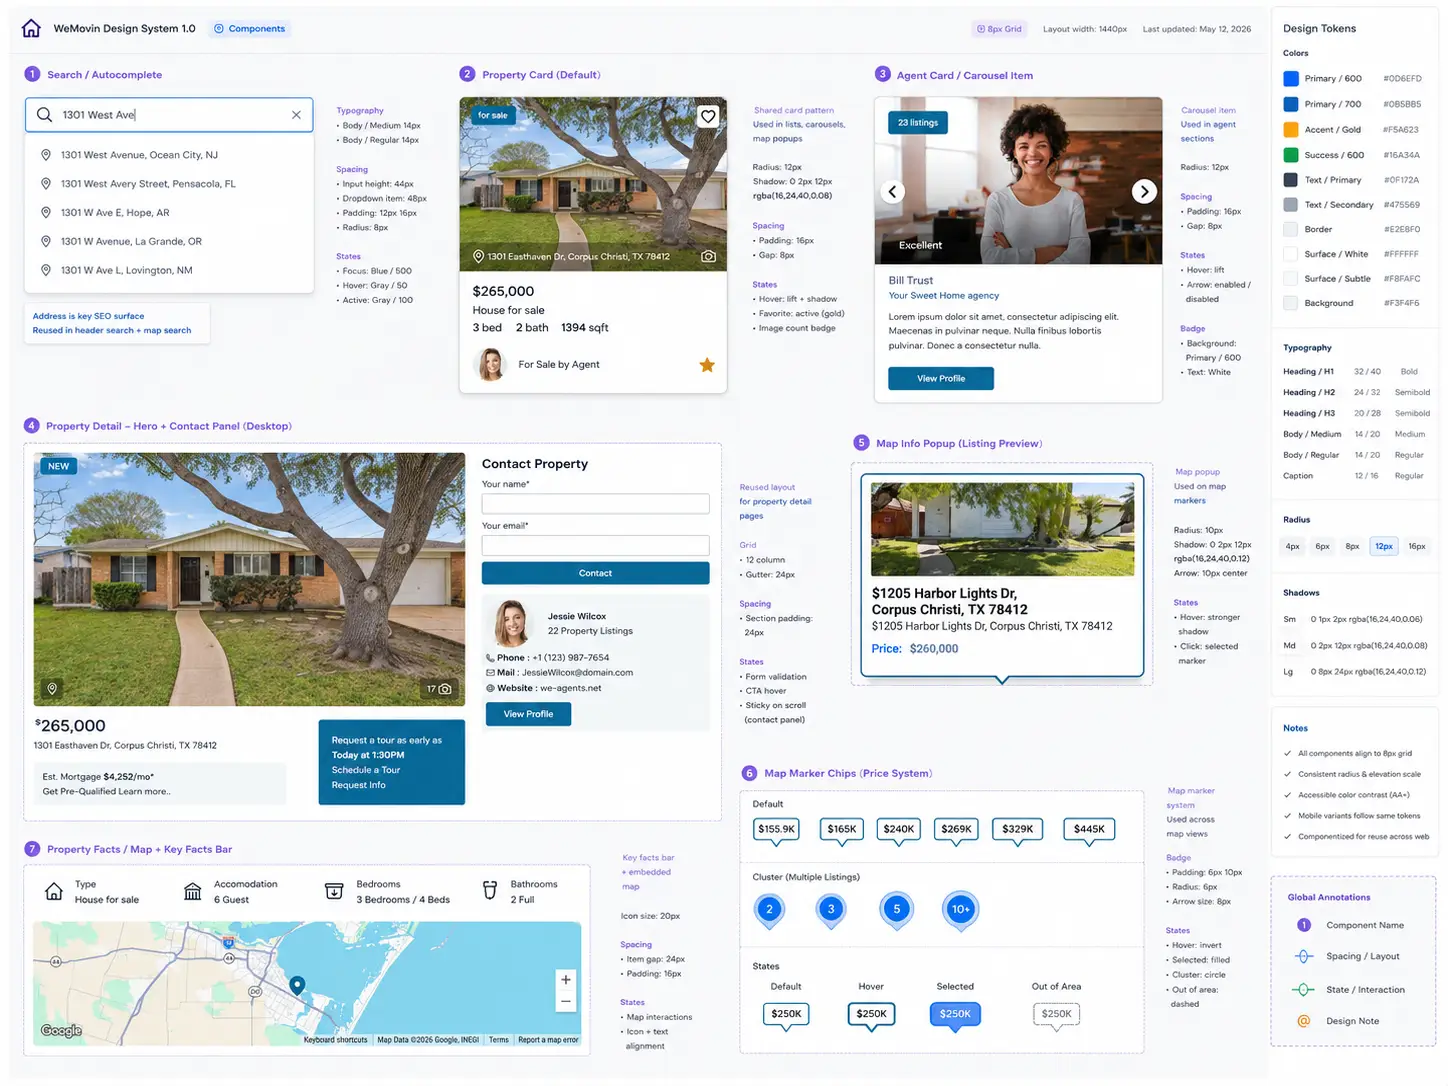
The product needed SEO-friendly property pages, fast iteration, reusable UI, and typed contracts between property data, map markers, listing cards, and detail pages.

Trade-off

Next.js added framework structure and routing conventions, but it gave the project a stronger foundation for search visibility, page organization, and future data loading patterns.

Impact

The team could move quickly without building a throwaway prototype or locking the UI into one-off styling decisions.

Deployment and iteration workflow

Vercelpreview deploymentsshort feedback loops

Compared against

manual server deploymentcustom CI/CD setupself-managed hosting

Why this direction

The startup needed fast review cycles between product, design, and engineering during the first web release.

Trade-off

Using a managed deployment platform reduced infrastructure flexibility, but it removed operational overhead at the stage where speed mattered more than custom hosting control.

Impact

Product and UI decisions could be reviewed quickly, which helped keep the first release moving under startup timelines.

Location and map platform

Google MapsPlaces AutocompletePlace ID resolutionviewport-based search

Compared against

MapboxOpenStreetMap-based stackcustom geocoding provider

Why this direction

The core experience depended on address search, place prediction, geocoding, map rendering, markers, and familiar location behavior for real estate users.

Trade-off

Google Maps introduced billing and request-control concerns, but it provided the most mature path for Places search, map interactions, and location accuracy.

Impact

Search and map behavior could be built around a proven ecosystem while still optimizing requests through debouncing, session handling, and viewport-based queries.

Data boundary and provider readiness

typed property modelsservice boundariesprovider-ready data layer

Compared against

raw API objects in componentshardcoded listing shapesprovider-specific UI logic

Why this direction

The first phase used controlled development data, but the long-term product direction assumed larger third-party property feeds and more complex listing workflows.

Trade-off

Adding a data boundary required more upfront structure, but it kept UI components independent from any single provider format.

Impact

The frontend could support the first release while remaining ready for larger datasets, normalized property records, and future provider integration.

Search & Map Architecture

One search flow connected autocomplete, routing, maps, and listings.

The core technical system behind WeMovin was the connection between Google Places, address-based routing, database lookups, and map state. A selected prediction could represent either a specific residential address or a broader location context, and each path needed a different product response.

Technical highlights

  • Intent-based routing: residential addresses opened property detail pages, while cities, schools, universities, and neighborhoods initialized map search.
  • Place ID resolution: selected Google Places predictions were resolved before routing, map initialization, or database lookup.
  • Request control: autocomplete used debouncing, limited suggestions, geographic constraints, and session-based Places handling to avoid noisy API behavior.
  • Viewport-driven results: map bounds defined the active result set instead of loading unrelated properties into the UI.
  • Marker-card synchronization: map markers, listing cards, selected states, and property previews represented the same filtered data state.
  • Scale-ready map layer: the structure left room for clustering, pagination, caching, and larger property data providers.
Annotated WeMovin map search interface Embedded screenshot of the WeMovin map search UI with vector callouts explaining Google Places autocomplete, viewport-based filtering, marker-to-card synchronization, and property preview interactions. 1 Places Autocomplete Search begins with a controlledGoogle Places prediction flow. 2 Price markers Markers represent visible listingsand support quick comparison. 3 Property preview Hover/select state exposes theprimary listing before navigation. 4 Viewport-based filtering The map area defines whichproperties are relevant right now. 5 Synced listing cards Cards update from the same resultset as the visible map markers. 6 Marker → card interaction Selecting a marker can drivethe preview and listing context. Annotated WeMovin map search interface Embedded screenshot background with vector SVG annotations for the portfolio case study.
Image description

The image is an annotated screenshot of the WeMovin map search interface. The main background is a Google-style map with multiple price markers placed across the visible area. A selected marker opens a property preview card with a home photo, address, and price. The right side of the interface contains listing cards for properties that match the current map view. Vector callouts identify key parts of the map experience: Places Autocomplete for search input, price markers for quick comparison, a selected property preview, viewport-based filtering, synchronized listing cards, and marker-to-card interaction. The annotations show that the map is not only a visual display but also controls which listings are considered relevant based on the current viewport.

Viewport-based map search with synchronized property markers and listing cards.

Search flow and routing logic diagram for WeMovin
Image description

The image is a whiteboard-style flow diagram describing WeMovin’s search flow and routing logic. It begins with a search input where the user enters a query, then moves to Google Places Autocomplete, where predictions are shown while the user types. After the user selects a prediction, the application resolves the selected place ID by requesting additional place details. A decision node then classifies the result as either a specific address or a broader area. The address path builds an SEO-friendly property URL, queries property details from the database, and opens a single property detail page. The area path initializes a map context for a city, school, university, or neighborhood, renders the Google Map, queries properties within the map bounds, detects the visible viewport, filters listings in view, and synchronizes markers with listing cards. Comment boxes explain that autocomplete is powered by Google Places, that place ID resolution happens after selection, and that map results update as users pan or zoom.

Search flow and routing logic behind WeMovin’s real estate discovery experience

Data Model & Frontend Boundaries

Typed property data shaped the frontend architecture.

Property data was the center of the product experience. The same model needed to support search results, map markers, listing cards, property detail pages, saved homes, claims, inquiries, and future provider integrations.

Instead of letting UI components consume raw data directly, the frontend was organized around typed models, feature boundaries, and service layers. This kept Google Maps, Places, property lookup, routing, and display logic easier to test and extend.

Architecture highlights

  • Property-first domain model: address, location, pricing, status, home facts, media, and display flags were centered around the property record.
  • Location-ready structure: latitude, longitude, city, state, and ZIP code supported map bounds, visible listings, and location-based search.
  • Service boundaries: Google Maps, Places autocomplete, property lookup, and routing logic were isolated from presentational UI components.
  • TypeScript contracts: shared property types kept API data, markers, cards, and detail pages aligned.
  • Provider-ready data layer: the controlled development dataset could later map to third-party property feeds without redesigning the frontend experience.
WeMovin data model diagram showing users, properties, saved properties, property claims, property photos, property details, and listing inquiries
Image description

The image shows an entity relationship style data model for WeMovin. The central table is properties, which contains fields such as id, external id, street address, city, state, postal code, country, latitude, longitude, price, currency, beds, baths, living area, lot area, property type, property subtype, status, days on market, featured state, rental state, year built, broker name, description, created date, updated date, and deleted date. The properties table connects to property photos, property details, property features, property media, saved properties, property claims, and listing inquiries. The users table contains account-related fields such as id, email, password hash, name, avatar URL, role, email verification date, created date, updated date, and deleted date. User preferences are stored separately and include fields for user ID, currency, units, default map settings, default search filters, and timestamps. Saved properties, property claims, and listing inquiries connect users to properties through separate relationship tables. The diagram also includes notes about indexes, one-to-many relationships, soft deletes, UTC timestamps, UUID primary keys, and TypeScript model alignment.

Data model and frontend boundaries for property search, map display, saved homes, claims, inquiries, and media.

UI System, Quality & Outcome

Reusable UI backed by tested product flows.

The interface was built around familiar real estate patterns: autocomplete search, map markers, listing cards, property galleries, filter controls, contact panels, and property fact sections. These patterns were implemented as reusable components rather than one-off screens.

Quality work focused on the flows where user trust mattered most: search selection, address routing, map viewport updates, property lookup, listing cards, and detail pages.

Component strategy

Search inputs, filters, cards, markers, galleries, CTAs, and detail sections were designed as reusable UI parts.

Design consistency

Spacing, radius, typography, shadows, and color roles were kept consistent across the product experience.

Critical flow testing

Testing focused on search classification, routing, map state, property rendering, and contact actions.

Low-dependency approach

Simple UI behaviors were handled with custom components and browser-native capabilities where possible.

Outcome

  • Delivered the first web phase of the core product loop: search → map results → property detail → contact/listing action.
  • Created a connected foundation between Places autocomplete, address routing, map state, typed property data, and reusable UI.
  • Left the product ready for larger property datasets, richer user workflows, and future mobile/PWA optimization.
WeMovin UI system showing reusable components, design tokens, property cards, search input, map markers, filters, gallery, and property detail sections
Image description

The image shows a Figma-style design system board for WeMovin. A dark left sidebar lists pages and layers for the UI system, including cover, foundations, components, patterns, templates, search autocomplete, property card, map markers, agent card, contact card, gallery, filter bar, and facts bar. The main canvas displays reusable interface components arranged in labeled groups. The search autocomplete component includes a text input with several address suggestions. The property card component shows a home photo, status label, address, price, bedroom and bathroom counts, square footage, agent information, and a save icon. The map marker section shows a map with clustered price markers. The agent card section shows multiple agent profile cards with photos, listing count badges, names, agency names, descriptions, and profile buttons. The contact section combines a property image, contact form fields, agent information, and a call-to-action button. The gallery section shows a large photo viewer with thumbnail images. The filter bar includes controls such as For Sale, Price, Beds, Baths, Property Type, and More Filters. The facts bar presents property facts such as type, accommodation, bedrooms, and bathrooms with icons. Notes around the canvas describe token usage, including color roles, radius, spacing, shadows, and typography. A color token row appears near the bottom with primary, neutral, success, warning, danger, surface, and background values.

Reusable UI components and design tokens for search, listings, maps, property details, filters, and contact flows.

Map interaction prototype showing location-based property discovery.